Texas has the 5th highest homelessness rate in the United States
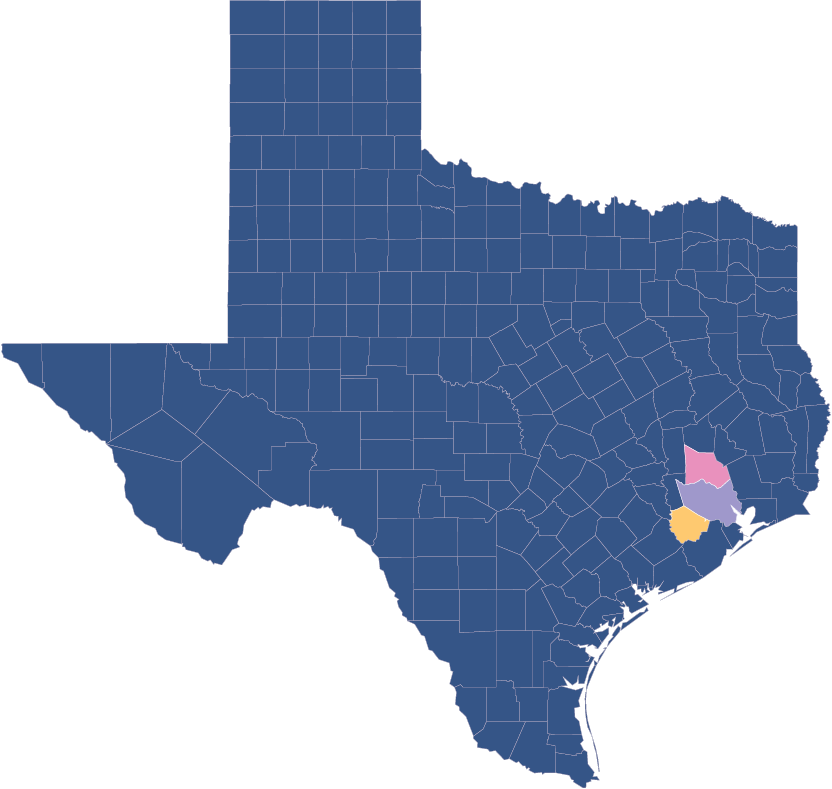
Homeless Population by State


Definitons
Unsheltered homelessness, which includes people living in places not meant for human habitation — abandoned or dilapidated buildings, the outdoors or a vehicle.
In addition to these categories, Houston is closely watching chronic homelessness — individuals who have been homeless for a year or more, and have a disabling condition that prevents them from living or working independently.
Unsheltered vs. Total Homeless Population
in Houston 2011–2023

The Sheltered Homeless Experience
Within the total population of 3,270, 47% of persons experiencing homelessness were in emergency shelters. This is an increase over
that found in 2022, likely due to relaxation of pandemic restrictions on maximum shelter bed occupancy levels. 15% of the total number of persons experiencing homelessness were in transitional housing. This year, 0.4% were located in Safe Havens.
The sheltered population may move from one county to another, particularly in counties where there is a lack of shelters for specific groups. For example, there are no shelters for single adults in Fort Bend County. Therefore, the location of both the unsheltered and sheltered populations may not reflect where they were living before experiencing homelessness.


But location is not the only detail affecting people
When taking race, ethnicity, sexuality, and gender into account, some things disproportionately influence someone’s housing status.
Primary Causes of Homelessness
Within Unsheltered Population in Houston

Race, Ethnicity, & Gender
No Data Found
Race and ethnicity are intertwined but different. While only 15% of people identified their ethnicity as Hispanic or Latino, 41% were White, 55% were Black, 1% Asian, 1% were Native American, and 2% were Mixed.
Men made up 62% of the homeless population making Women 38%. Four people from this data set identified as transgender and were placed into the category they transitioned into.

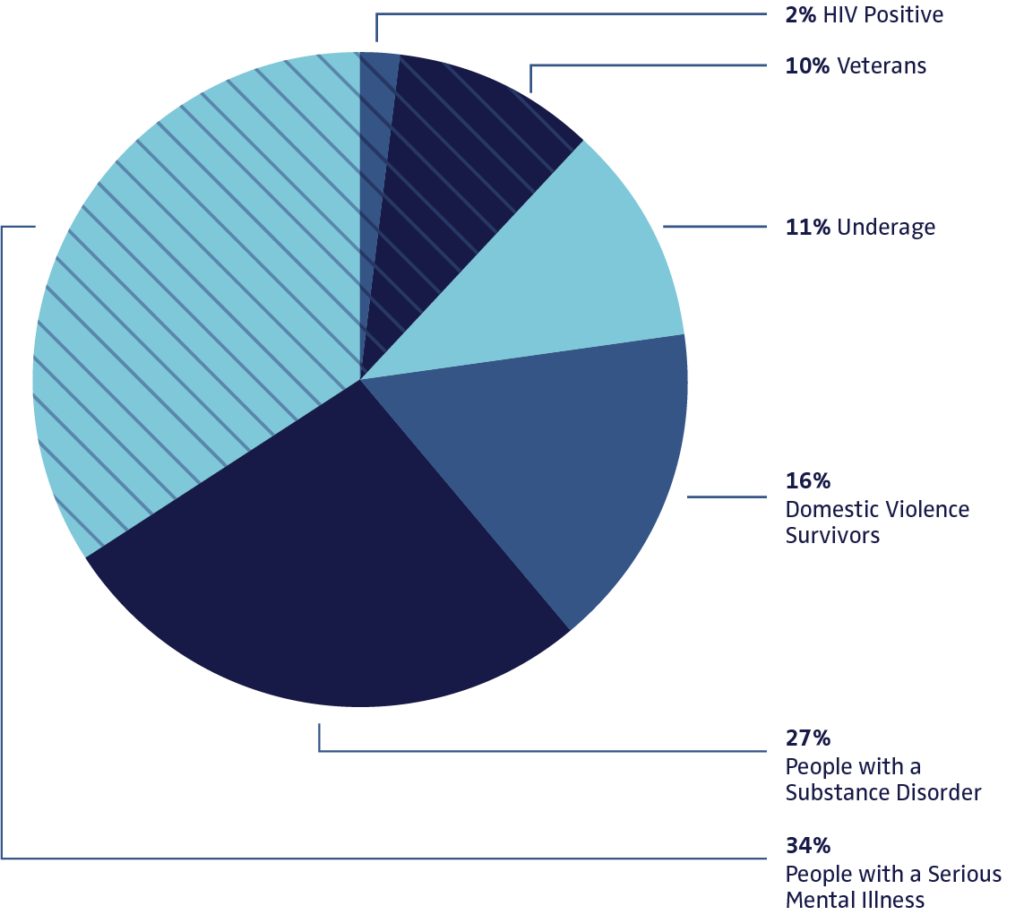
Subpopulations
These self-reported statistics connect to the causes of homelessness as well as time experiencing homelessness. When looking into these subpopulations, specific groups of people are more affected than others. For example, women are more likely to suffer from domestic violence than men.
Time Experiencing
Unsheltered Homelessness
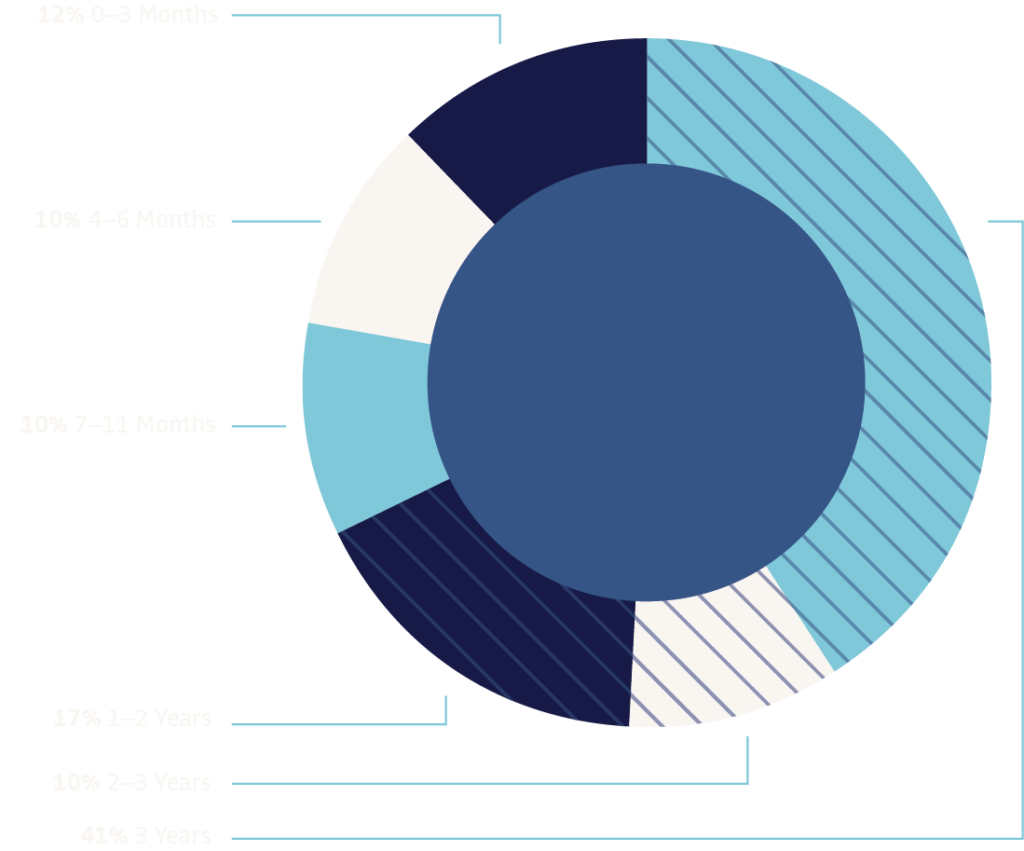
Forty-one percent of unsheltered persons had been homeless for three years or longer while 12% were newly homeless (three months or fewer). It’s important to understand that the information is self reported. As mentioned earlier, chronic homelessness is when an individual is homeless for more than one year, which Houston is hoping to combat through different housing programs.

